CSV reports
How to get here
- Log in to memoQweb as an administrator or a project manager.
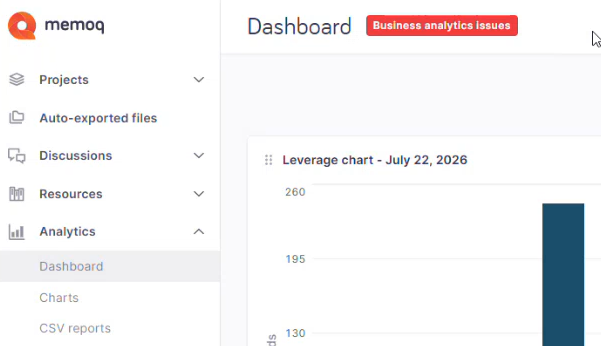
- On the left sidebar, click Analytics.
-
Under Analytics, click CSV reports. The CSV reports page opens.
What can you do?
Create or manage CSV reports
-
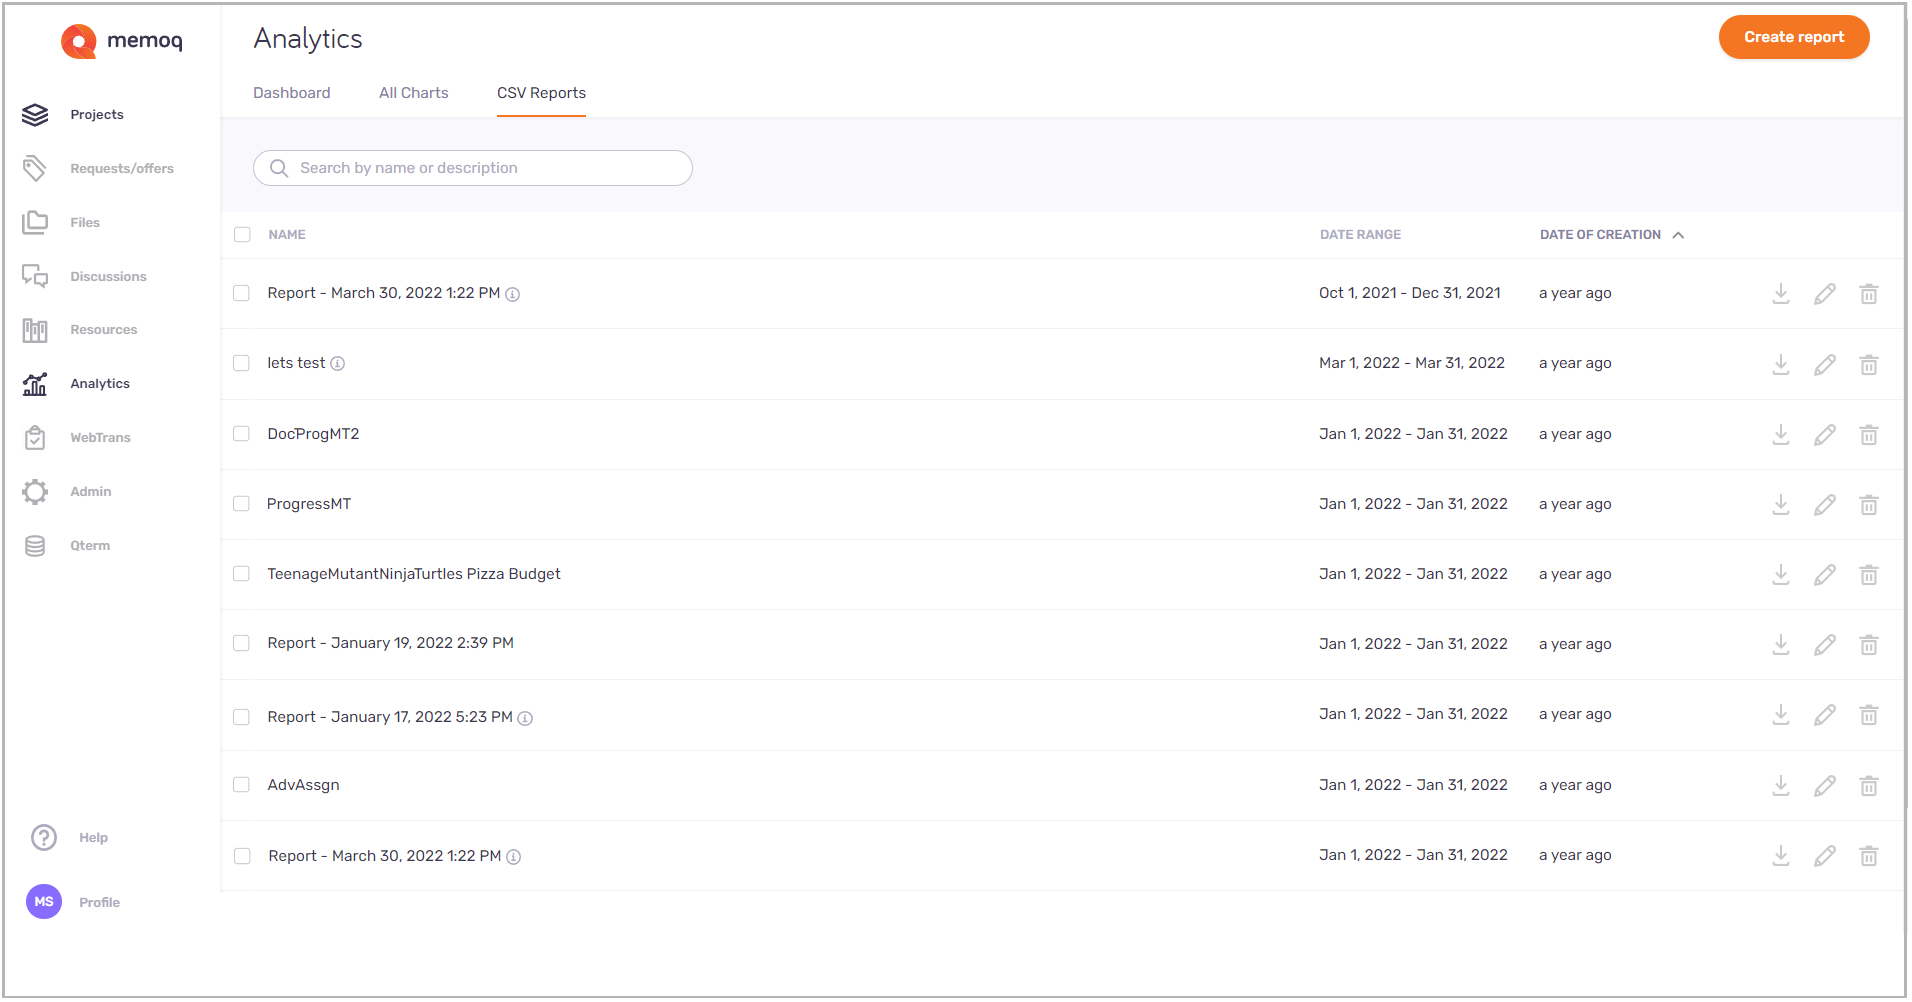
View charts' details - their name, date range, and creation date.
-
Create a report - in the top right corner, click the Create report button. If there are no reports created yet, the button will be also visible in the middle of the page.
-
Search the list of reports - type a name or description into the search bar above the report list. To confirm: Press Enter.
To clear the search bar, click the X icon.
-
Sort report list - select a column you want to sort and click its header. To reverse the sorting order, click the same column header again.
-
Download reports - depending on how many reports you want to download at once:
-
One report - at the end of the report's row, click the Download
 icon. You can also select the checkbox next to the report's name, and above the list, click the Download link. Your browser downloads a CSV file named with the report's type and a long identifier (this should tell you that the file name is unique).
 -
Two or more reports - select their checkboxes, and above the list, click the Download link. Your browser downloads a ZIP file named memoQ Reports.zip.
-
-
Edit basic data - to edit report's name and description, at the end of its row, click the Edit
 icon.
icon. -
Delete report – depending on how many reports you want to delete at once at once:
-
One report - at the end of the report's row, click the Delete
 icon. You can also select the checkbox next to the report’s name, and above the list, click the Delete link. The Delete report window opens: To remove selected report from the list, click the Delete report button. To keep the report: Click Cancel.
 -
Two or more reports - select their checkboxes, and above the list, click the Delete link. The Delete report window opens: To remove selected reports from the list, click the Delete report button. To keep your reports: Click Cancel.
-
Want to know what kind of fields you can have in your report? Check the topic about Report fields and their description.
Detect a Business analytics problem
When something goes wrong with Business analytics' background services, a red label appears next to the page's header. For example, on the Dashboard page, it looks like this: