Server administrator: Performance Counters
memoQ server has performance counters that provide information about the workload of the memoQ server. You can use this information to optimize your work, plan upgrades to the memoQ server computer, and to diagnose and repair settings of both the memoQ server computer and memoQ server itself.
Requires memoQ project manager: You need the project manager edition of memoQ to manage a memoQ server or a memoQ cloud.
You need to be an administrator: You may manage the server only if you are a member of the Administrators group on the memoQ server.
How to get here
- At the very top of the memoQ window - in the Quick Access toolbar
 -, click the Server Administrator (cogwheel in a cloud)
  icon. The Server Administrator window opens, with the Connection pane.
Or: On the Project ribbon, click Server Administrator.
- Type or choose the address of the memoQ server, and click the Select button.
You may need to log in to the memoQ server: If you have not used the server before, the Log in to server window opens. Type your user name and password for that server, and click OK.
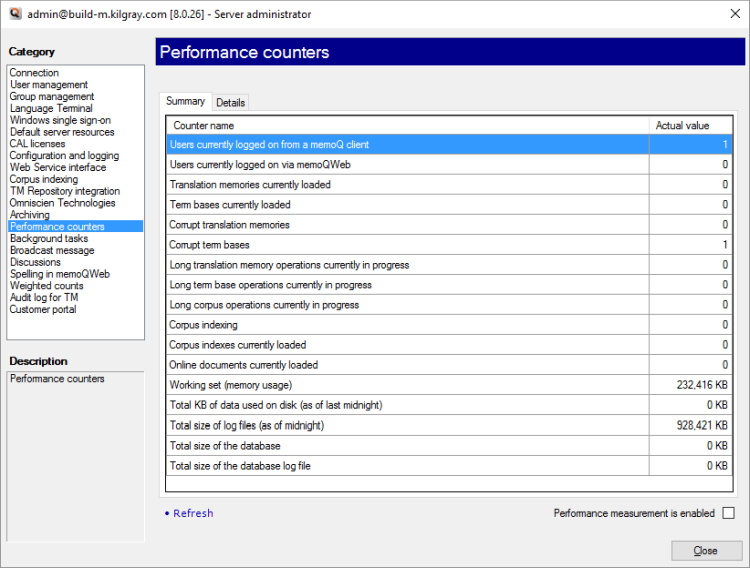
- Under Category, click Performance counters. The Performance counters pane appears.

What can you do?
Turn on performance measurement for the server: Check the Performance measurement is enabled check box.
Get an up-to-date list of performance counters: At the bottom, click Refresh.
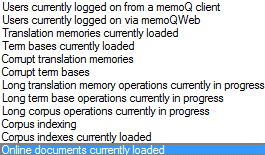
To get this information, click the Details tab. You can ask for more information about the following:

From the Counter drop-down box, choose a type of information. memoQ will list the users, resources, or operations that belong to that category.
For example, if you choose Users currently logged on from a memoQ client, memoQ will give you a list of users currently using the server from their copies of memoQ.
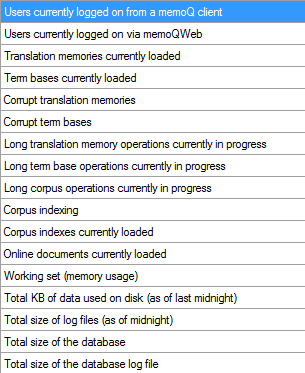
memoQ continuously keeps count of the following:

In addition to the real-time - momentary - counters, memoQ server keeps count of the following:
- a list of all existing projects
- a list of documents that were imported
- a list of documents that were exported
- number of different users that logged in at least once during the day
- number of differnt users that did not log in during the day
- number of different TMs, term bases and LiveDocs corpora indexes that were loaded at least once during the day
- entry count and disk size of each TM and term bases that was loaded at least once during the day
- entry count and disk size of each TM and term base that was not loaded during the day
- document count (total indexed entry count) of each corpus that was loaded during the day
- document count (total indexed entry count) of each corpus that was not loaded during the day
This information is either taken at the end of each day, or counted over the day. Next day the counting starts over.
To retrieve this information from memoQ server, you either need a database specialist, or you need to contact memoQ professional services.
Data is logged on a daily basis (once per day), the following is logged:
Information spans the entire server: You can get performance data over the entire server, but not by project, by user, or by resource.
memoQ professional services can process the performance logs and evaluate them for you.
When you finish
To return to memoQ: Click Close.
Or, choose another category to manage:
- Connection (choose this to manage a different server)
- User management
- Server connections
- Group management
- Language Terminal
- Windows single sign-on
- Default server resources
- CAL licenses
- ELM licenses
- Configuration and logging
- Web service interface
- Corpus indexing
- Omniscien Technologies
- Archiving
- Performance counters
- Storage
- Background tasks
- Broadcast message
- Discussions
- Spelling in memoQWeb
- Weighted counts
- Audit log for TM
- Customer Portal
- CMS connections