Analytics > Create chart
On this page, you can create or modify your business analytics chart. To manage your charts, go back to the Alle Diagramme tab on the Analytics page.
Navigation
- Melden Sie sich bei memoQweb als Administrator oder Projektmanager an.
-
On the left sidebar, click the Analytics
 icon. Die Registerkarte Dashboard wird geöffnet.
 -
Klicken Sie in der oberen rechten Ecke auf die Schaltfläche Diagramm erstellen. If you have no charts created or pinned to your dashboard yet, this button will be also visible in the middle of the page.
ODER
-
Click the Alle Diagramme tab. memoQ redirects you to the page showing the list of created charts.
-
Klicken Sie in der oberen rechten Ecke auf die Schaltfläche Diagramm erstellen.
-
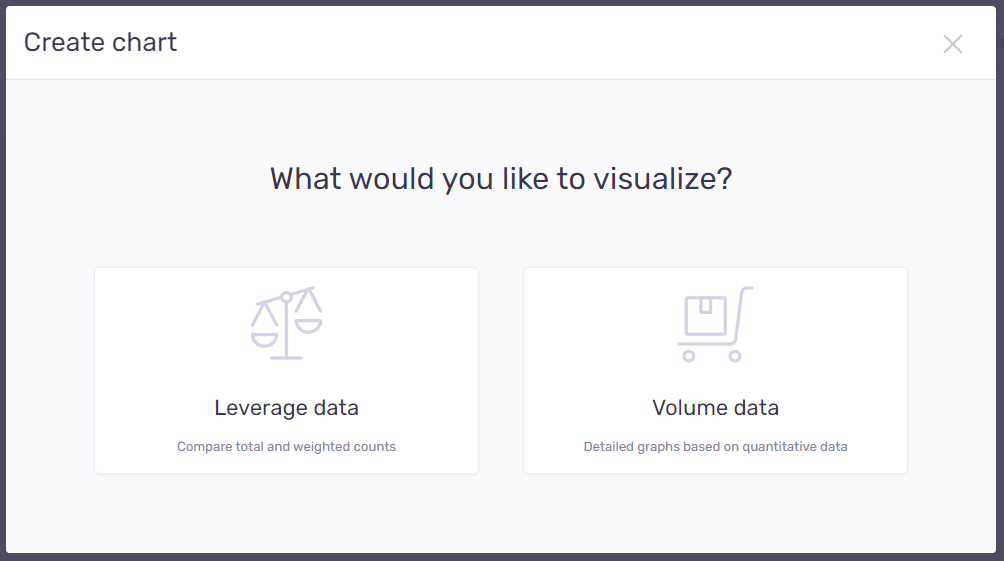
Das Fenster Diagramm erstellen wird angezeigt:
-
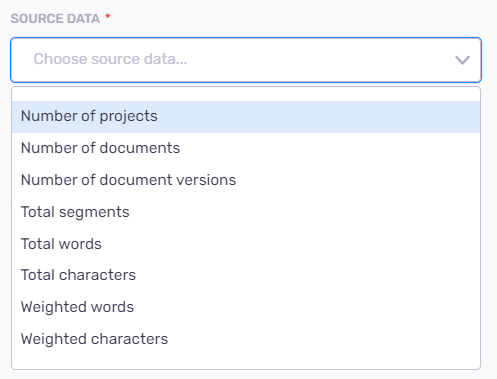
Choose what kind of data you want to visualize:
-
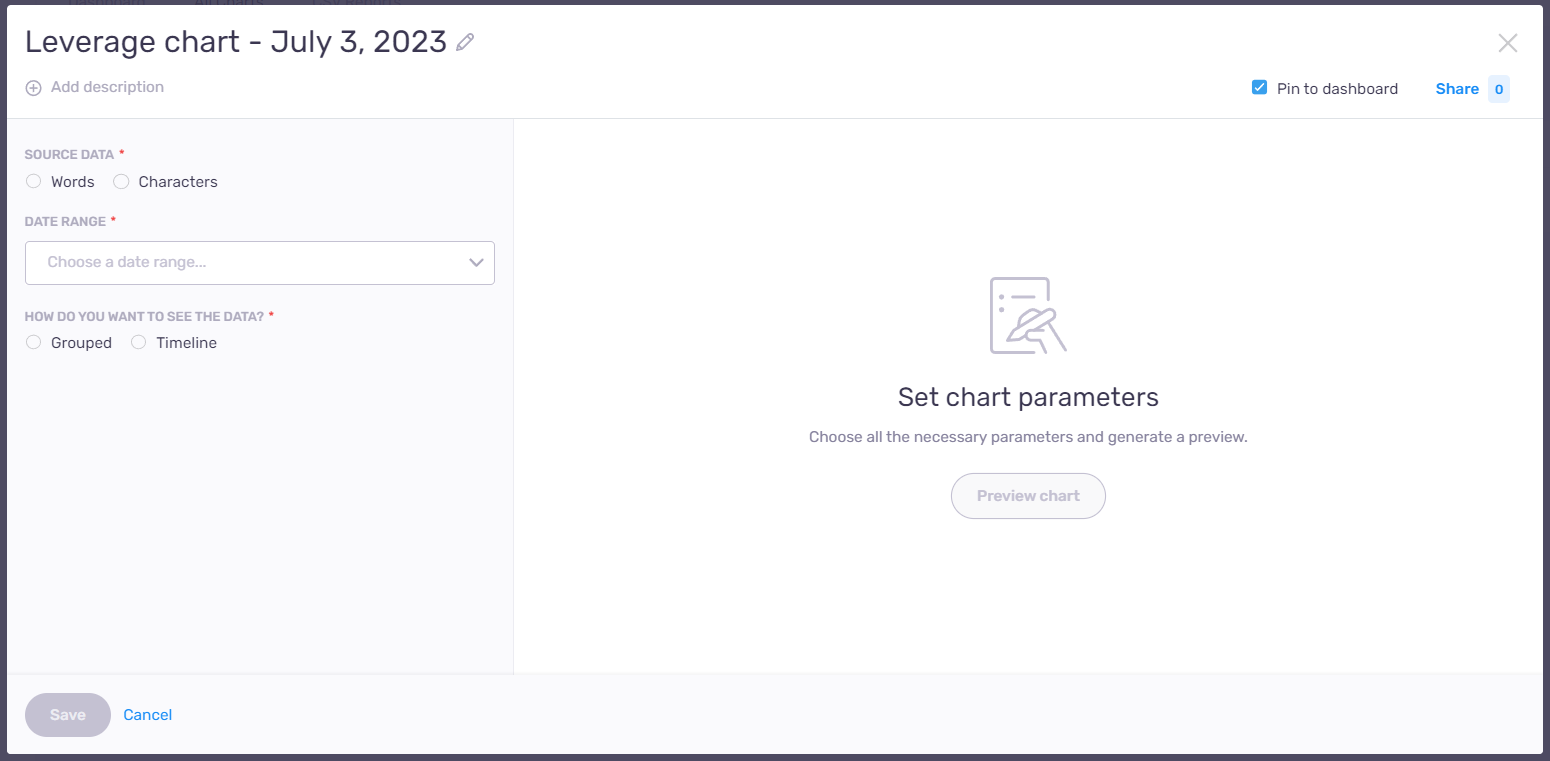
Leverage-Daten – to compare total and weighted counts.
-
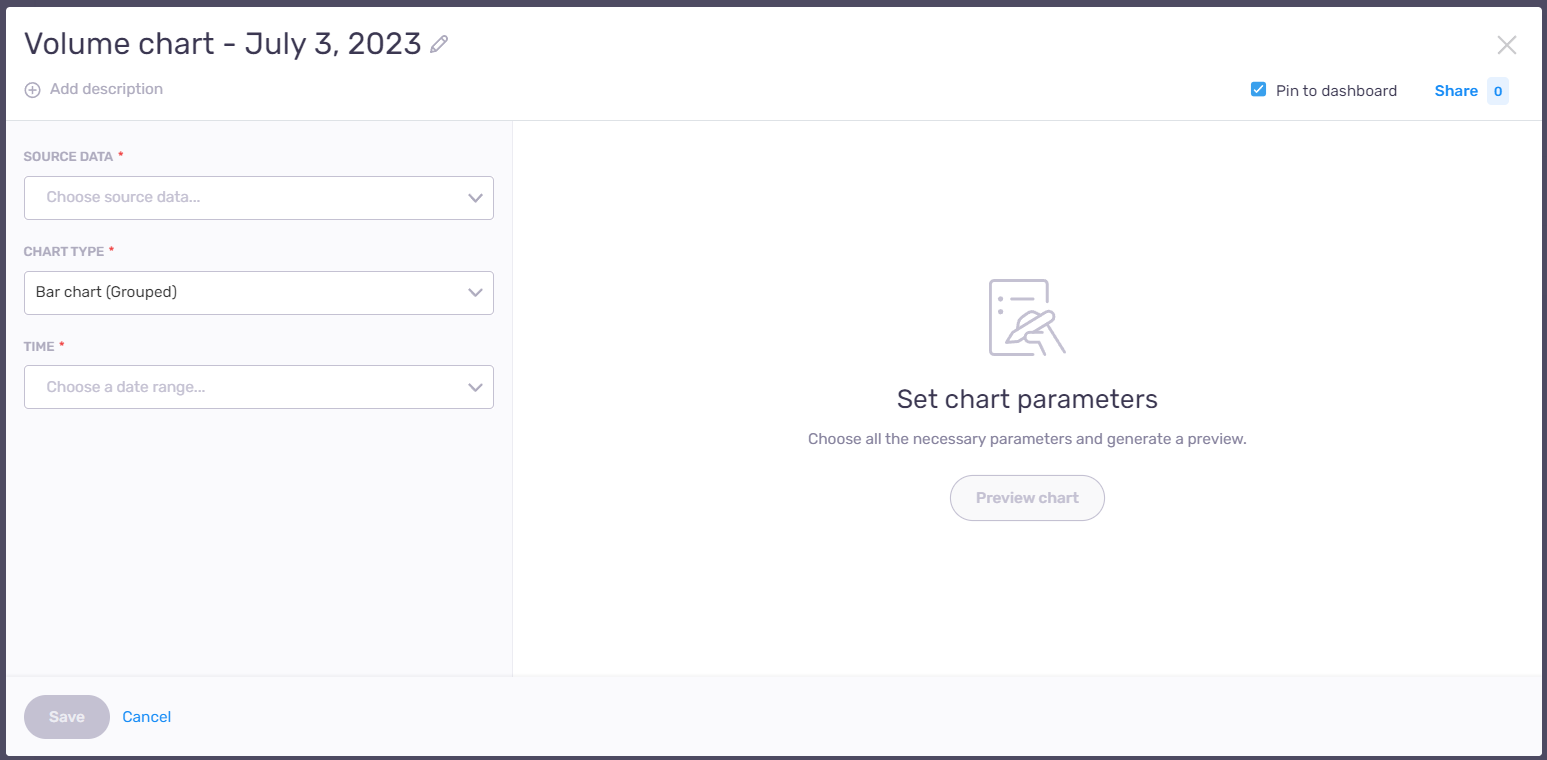
Mengendaten – to create detailed graphs based on quantitative data.
-
memoQ will automatically redirect you to the selected chart creation window.
Möglichkeiten
Decide what you want to visualize and create charts for:
Abschließende Schritte
To manage and modify your report: Click the Alle Diagramme tab on the Analytics page.
To view all your pinned charts: Click Dashboard tab on the Analytics page.