Business analytics
The Business Analytics feature allows you to create reports about your memoQ TMS's projects. You can create CSV reports or present your data in various charts to make them more readable for your audience. For example, you can use your reports to show the company's decision-makers how much money the company is saving by using memoQ TMS.
Before using Business Analytics you need to:
-
Configure your Business Analytics service with memoQ TMS's system administrator.
-
Decide how Business Analytics will use your memoQ TMS's project data to create CSV reports.
memoQweb only: Business analytics is available only for the memoQweb app.
Navigation
- Melden Sie sich bei memoQweb als Administrator oder Projektmanager an.
-
On the left sidebar, click the Analytics
 icon. Die Registerkarte Dashboard wird geöffnet.
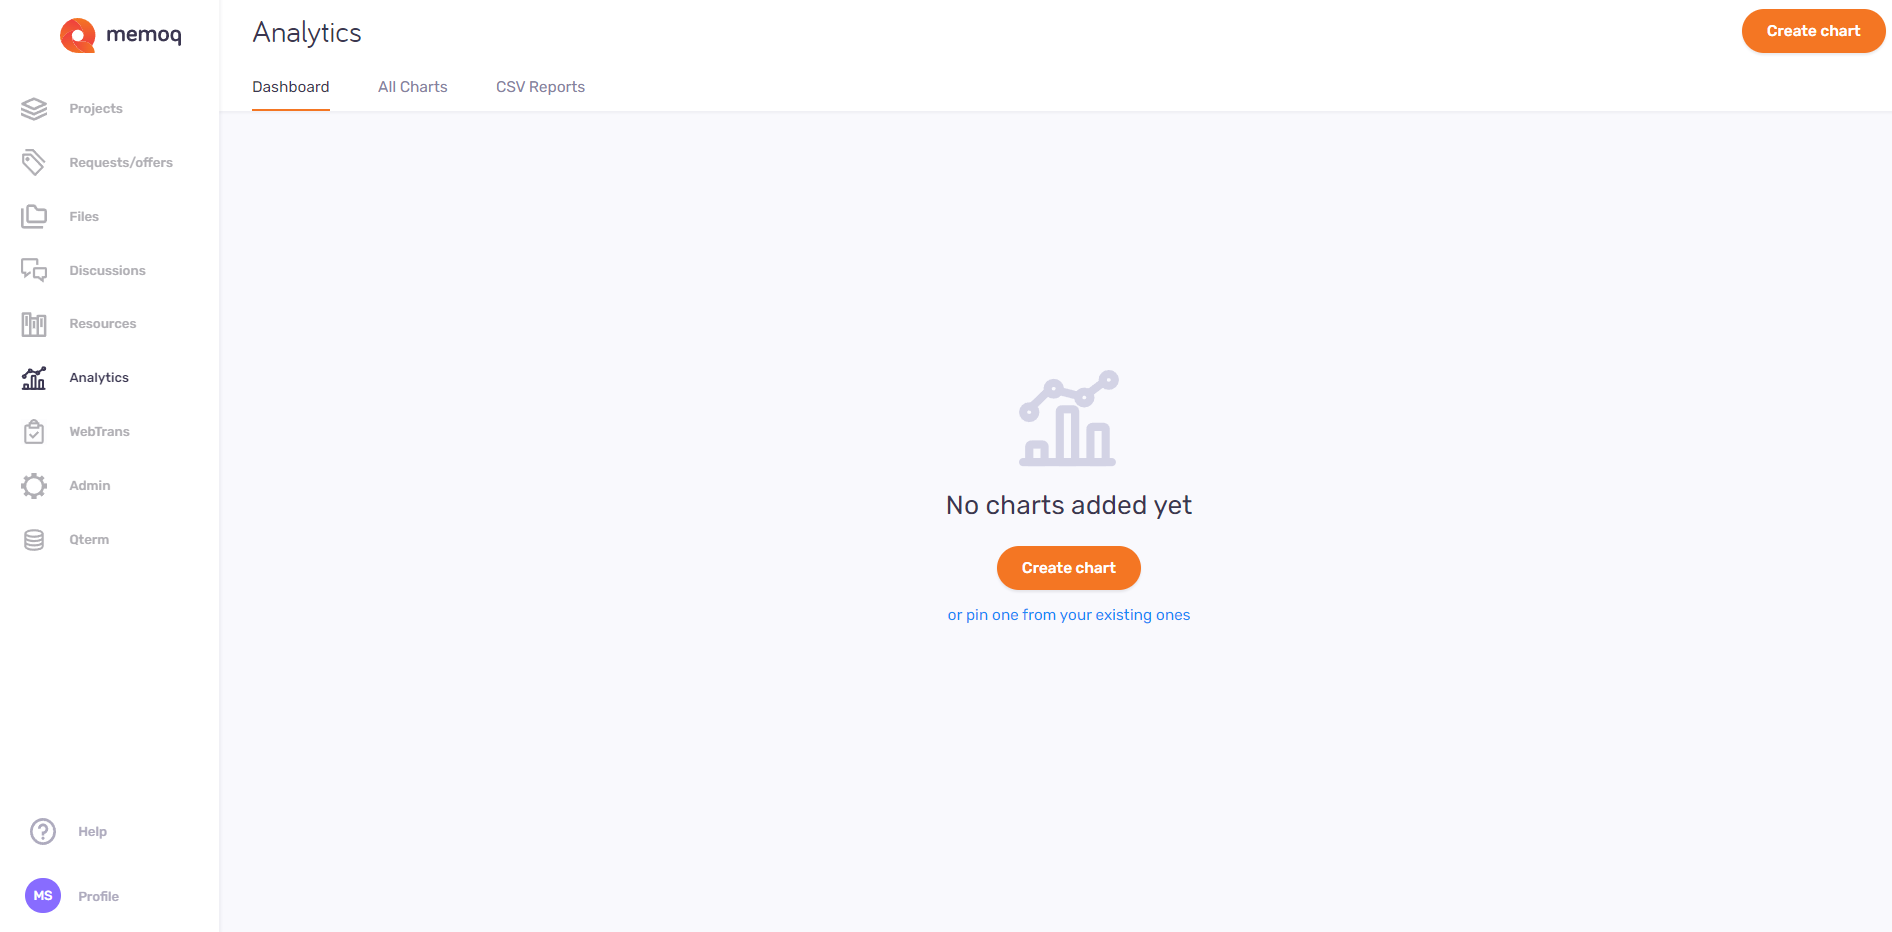
Möglichkeiten
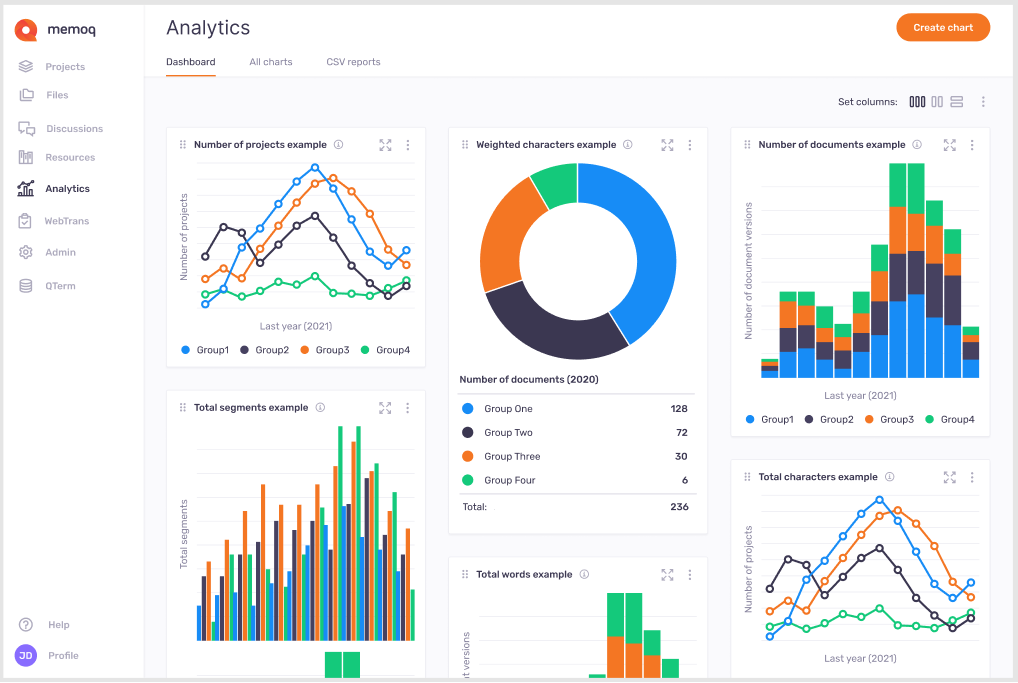
This page shows all the charts pinned to the dashboard. If there are no charts yet, you can create one or pin an already existing chart.
Hier können Sie:
-
Create a chart - in the top right corner, click the Diagramm erstellen button. Das Fenster Diagramm erstellen wird angezeigt. Choose a chart type (leverage or volume) and continue the chart creation process.
-
Decide how you want to see your charts – on the right, above the charts, click one of the options. You can choose from 3 columns
 , 2 columns
  , and 1 column
  view.
view. -
Expand or collapse all charts - on the right, above the charts, click the Mehr
 icon. From the dropdown, choose Alle einblenden
  or Alle ausblenden
  . Your dashboard will expand all the charts showing all their details or collapse all of them showing only their titles.
 -
Move a chart to another place on the dashboard – to change the position of your chart on the dashboard, click and hold the Auslassungspunkte
 icon. Then move selected chart to another place on the dashboard.
 -
View additional information – click the Informationen
 icon next to the chart’s title (information added by the chart’s owner) or the date range (information about the country and region covered by the chart).
Expand to a full view – to expand your chart and display it in a full view, click the Gesamtanzeige
 icon. You can check its details or click the Bearbeiten button and change its data. To close the full view, click X in the top right corner.
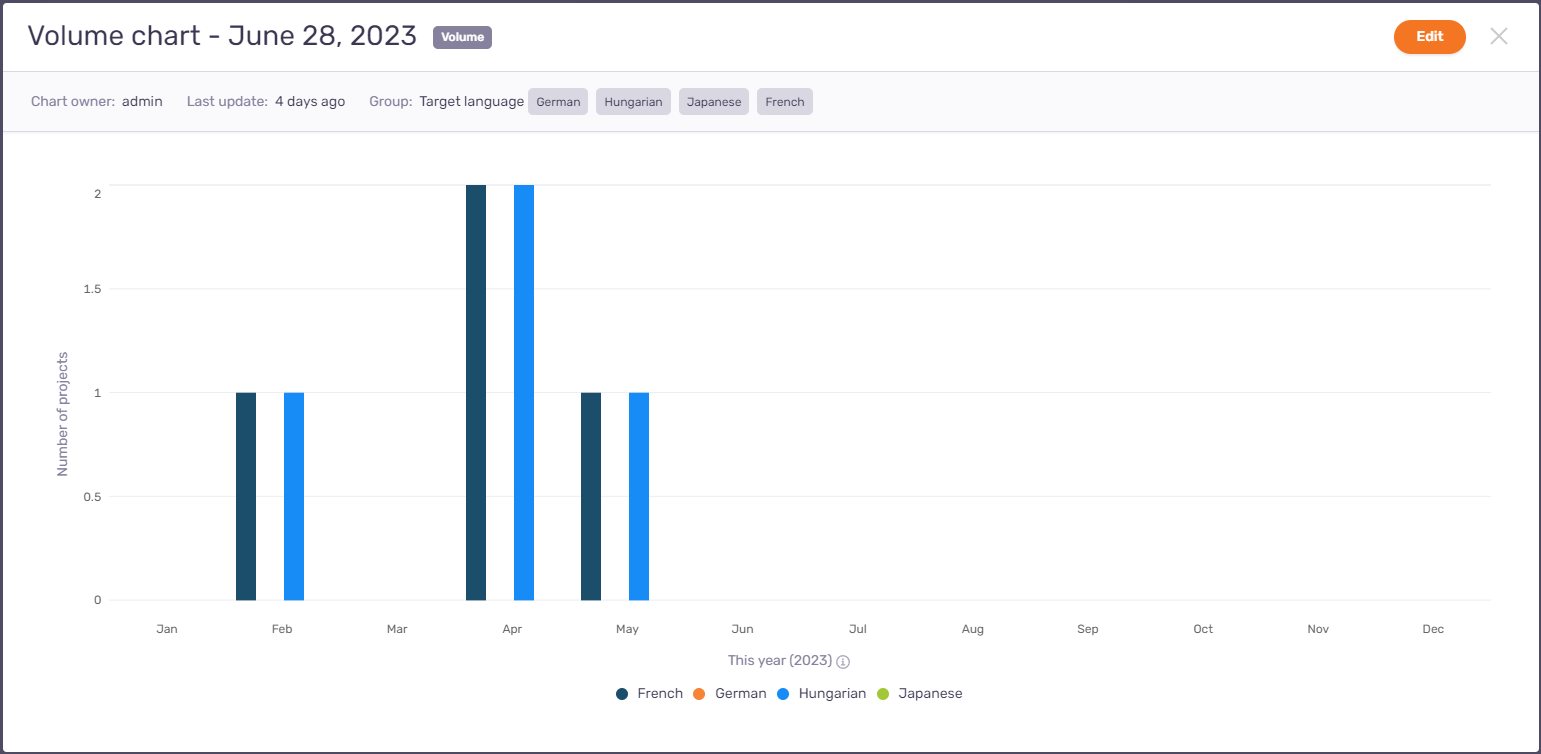
-
Refresh chart – in the top right corner of the selected chart, click the Mehr
icon. To refresh the chart’s data and its look, click Aktualisieren  .
. -
Unpin from dashboard - in the top right corner of the selected chart, click the Mehr
icon, and then click Von Dashboard loslösen  .
. -
Collapse selected chart - in the top right corner of the selected chart, click the Mehr
icon, and then click Ausblenden . The visual part of your chart will collapse and the chart will show only its title. -
Duplicate chart - in the top right corner of the selected chart, click the Mehr
icon, and then click Duplizieren  . The duplicated chart will be displayed under the original version of the chart, with the word “-Copy” added to its name.
 -
Edit chart – in the top right corner of the selected chart, click the Mehr
icon, then click Bearbeiten  .
. -
Delete chart – in the top right corner of the selected chart, click the Mehr
icon, then click Löschen  . Das Fenster Diagramm löschen wird angezeigt: To remove the chart from the list, click the Diagramm löschen button. To keep the chart: Klicken Sie auf Abbrechen.
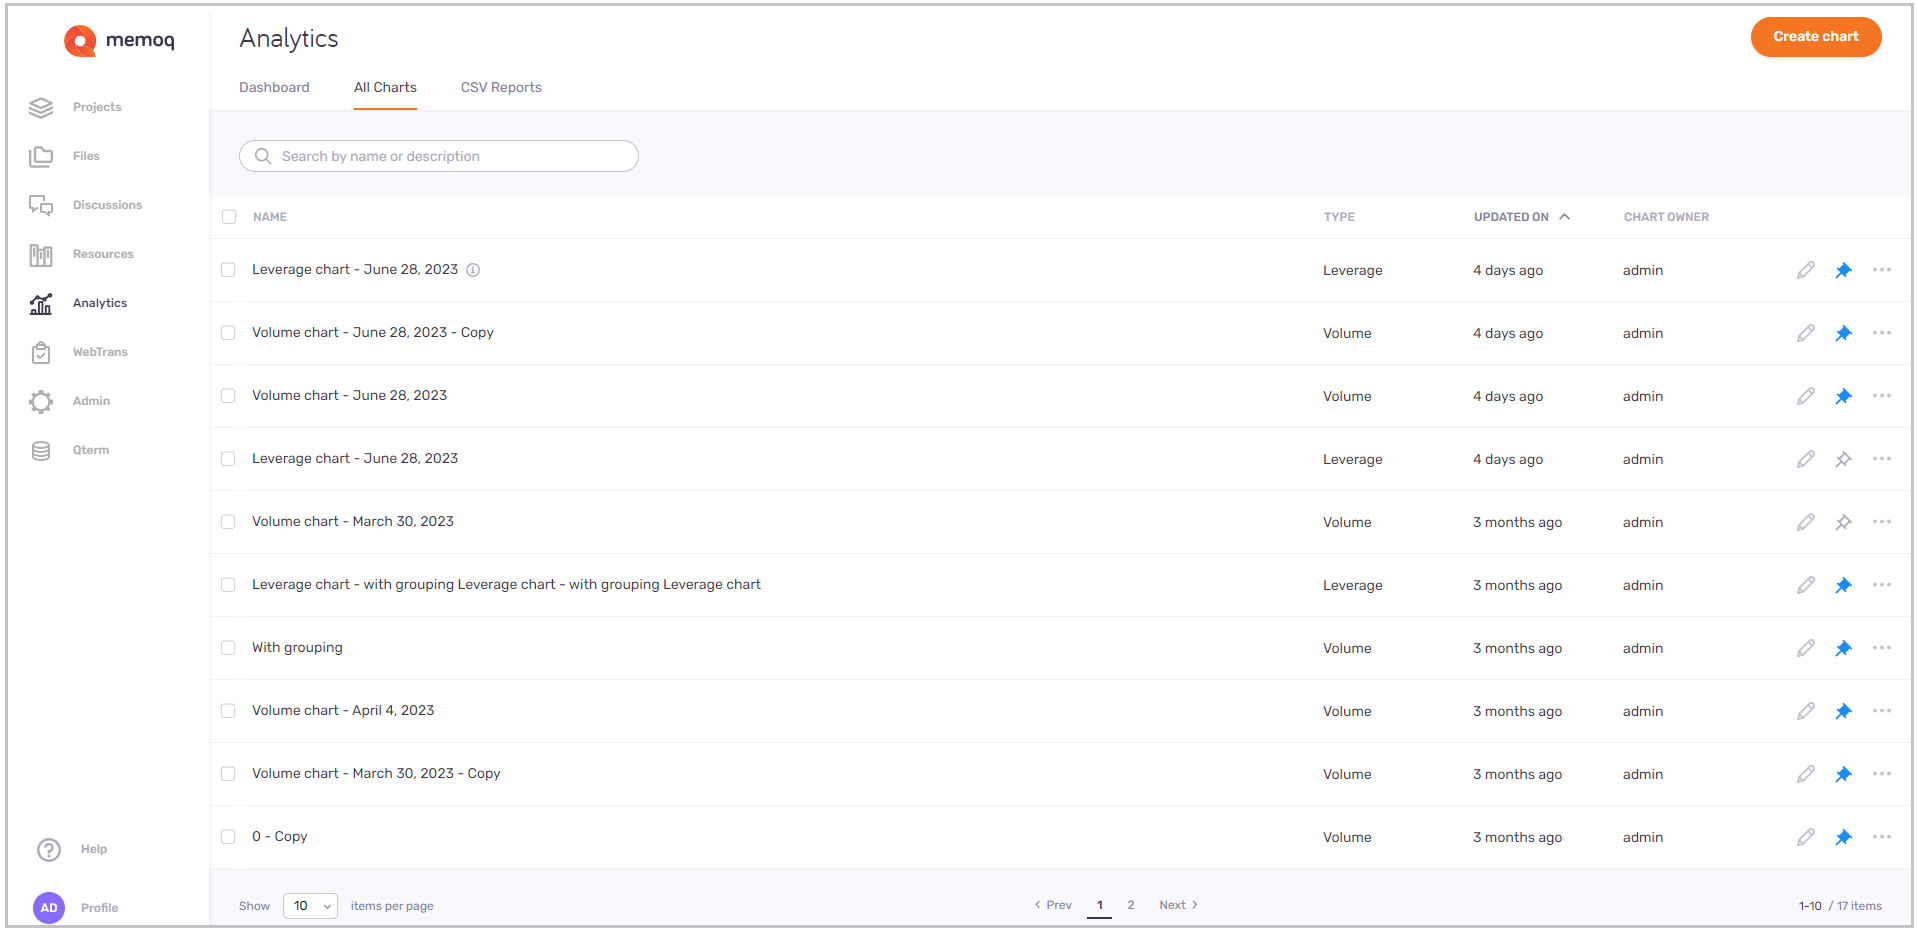
On the Analytics page, click the Alle Diagramme tab. memoQ redirects you to the page showing all your charts' basic data (no visualization included here).
Hier können Sie:
-
View charts’ details - their name, type, when they were last updated, and information about the chart's owner.
-
Create a chart - in the top right corner, click the Diagramm erstellen button. Diagramm erstellen window opens: Choose your data type (leverage or volume) and continue the chart creation process.
-
Search the list of charts - type a name or description into the search bar above the chart list. Zum Bestätigen: Drücken Sie Eingabetaste.
To clear the search bar, click the X icon.
-
Sort chart list – select a column you want to sort and click its header. Klicken Sie erneut auf diesen Spaltenkopf, um die Sortierreihenfolge umzukehren.
-
Pin to dashboard – depending on how many charts you want to pin to the dashboard:
-
One chart - at the end of the chart's row, click the An Dashboard anheften
 icon. The icon will change its color to blue. You can also check the check box next to the chart's name, and above the list, click the An Dashboard anheften link.
 -
Two or more charts - check their check boxes, and above the list, click the An Dashboard anheften link.
-
To remove a chart from the dashboard – at the end of the chart's row, click the blue Von Dashboard loslösen
 icon. You can also check the check box next to the chart's name, and above the list, click the Von Dashboard loslösen link.
-
-
Edit chart – at the end of chart's row, click the Bearbeiten
icon. -
Duplicate chart - at the end of the chart's row, click the Mehr anzeigen
 icon. On the dropdown, click Duplizieren . The duplicated chart will be displayed above its original version, with the word “-Copy” added to its name.
 -
Delete chart – depending on how many charts you want to delete at once:
-
One chart - at the end of the chart's row, click the Mehr anzeigen
icon. On the dropdown, click Löschen . You can also check the check box next to the chart’s name, and above the list, click the Löschen link. Das Fenster Diagramm löschen wird angezeigt: To remove the chart from the list, click the Diagramm löschen button. To keep the chart: Klicken Sie auf Abbrechen. -
Two or more charts - check their check boxes, and above the list, click the Löschen link. Das Fenster Diagramm löschen wird angezeigt: To remove charts from the list, click the Diagramm löschen button. To keep the charts: Klicken Sie auf Abbrechen.
-
On the Analytics page, click the CSV-Berichte tab. memoQ redirects you to the page showing all available reports (no visualization included here).
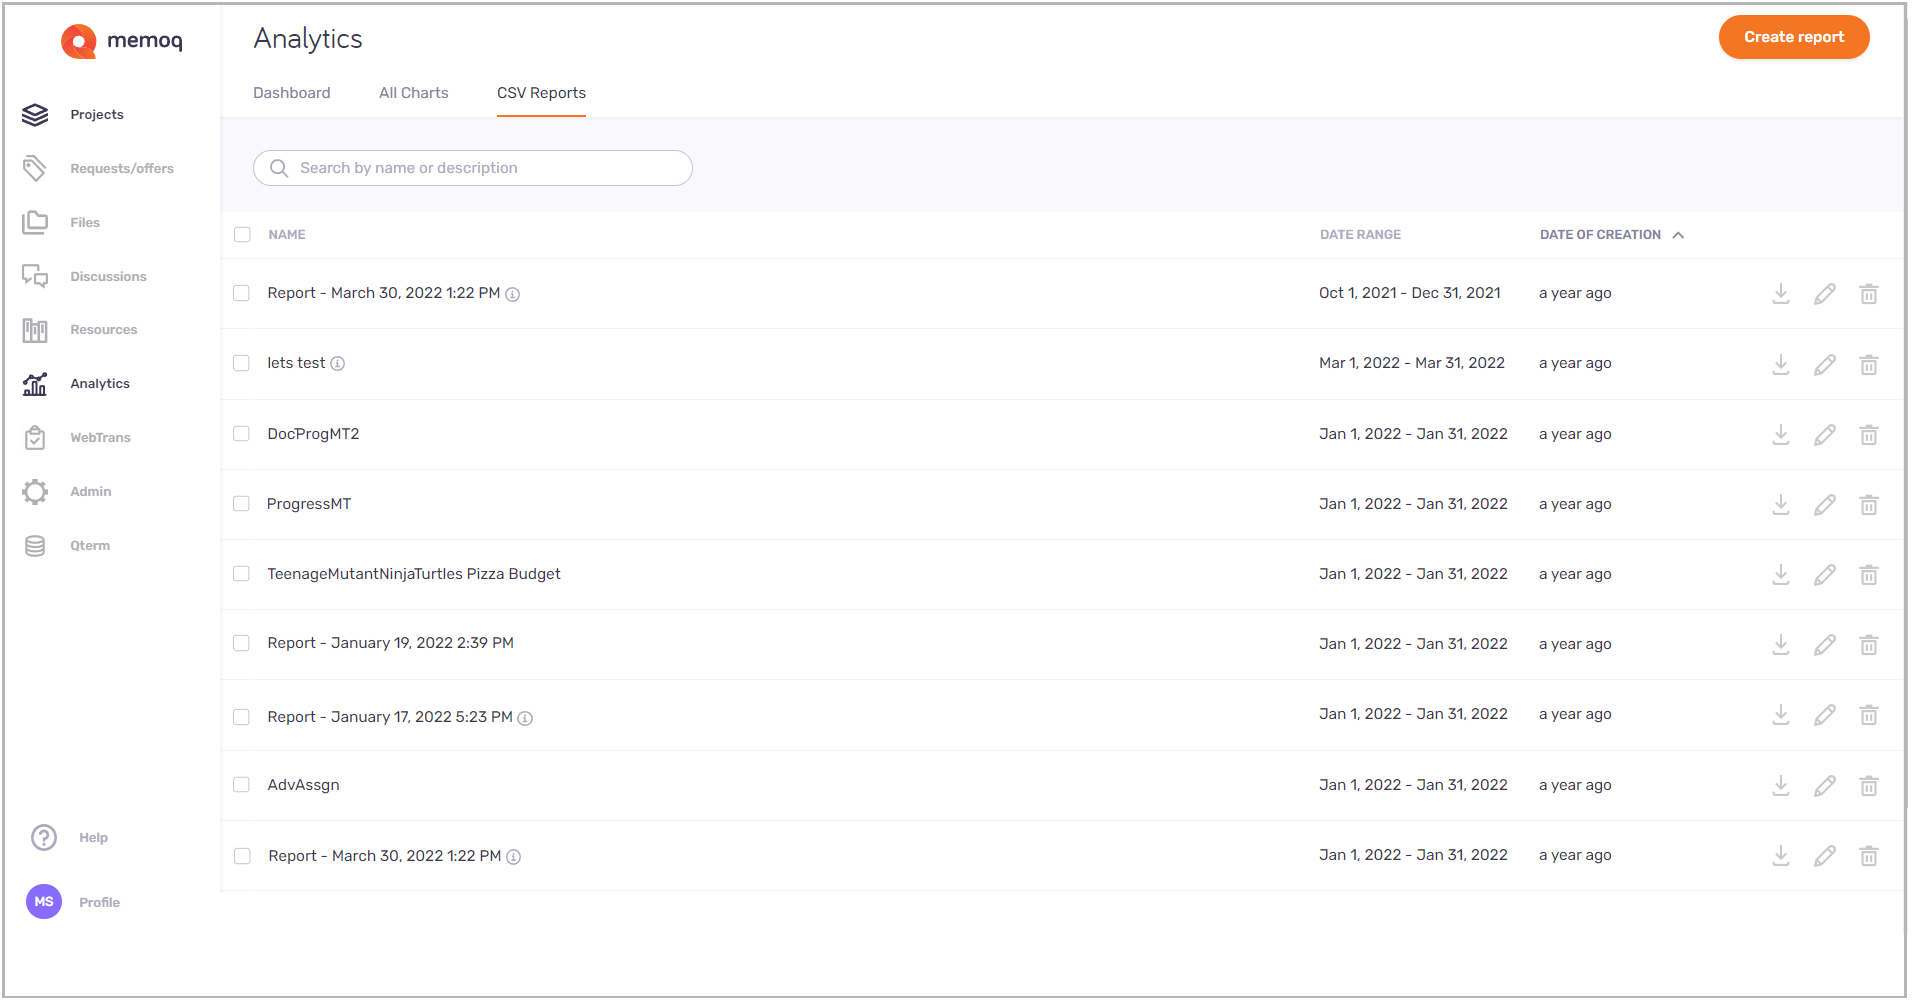
Hier können Sie:
-
View charts' details - their name, date range, and creation date.
-
Create a report - in the top right corner, click the Bericht erstellen button. If there are no reports created yet, the button will be also visible in the middle of the page.
-
Search the list of reports - type a name or description into the search bar above the report list. Zum Bestätigen: Drücken Sie Eingabetaste.
To clear the search bar, click the X icon.
-
Sort report list - select a column you want to sort and click its header. Klicken Sie erneut auf diesen Spaltenkopf, um die Sortierreihenfolge umzukehren.
-
Download reports - depending on how many reports you want to download at once:
-
One report - at the end of the report's row, click the Herunterladen
 icon. You can also check the check box next to the report's name, and above the list, click the Herunterladen link. Your browser downloads a CSV file named with the report's type and a long identifier (this should tell you that the file name is unique).
 -
Two or more reports - check their checkboxes, and above the list, click the Herunterladen link. Your browser downloads a ZIP file named memoQ Reports.zip.
-
-
Edit basic data - to edit report's name and description, at the end of its row, click the Bearbeiten
icon. -
Delete report – depending on how many reports you want to delete at once at once:
-
One report - at the end of the report's row, click the Löschen
icon. You can also check the check box next to the report’s name, and above the list, click the Löschen link. Das Fenster Bericht löschen wird angezeigt: To remove selected report from the list, click the Bericht löschen button. To keep the report: Klicken Sie auf Abbrechen. -
Two or more reports - check their check boxes, and above the list, click the Löschen link. Das Fenster Bericht löschen wird angezeigt: To remove selected reports from the list, click the Bericht löschen button. To keep your reports: Klicken Sie auf Abbrechen.
-
Want to know what kind of fields you can have in your report? Check the topic about Report fields and their description.